December 11, 2020
GPMA editor team
December 11, 2020
GPMA editor team
I The business climate index of Paper and Cardboard Container Manufacturing Industry in September 2020
The business climate index of Paper and Cardboard Container Manufacturing Industry in September 2020 is 80.15, increasing by 0.87 in comparison to August. In September, the index transferred from the super-cooling zone to the cooling zone, as shown in figure 1.
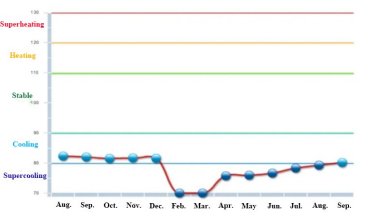
Figure 1 Run chart of the business climate index of Paper and Cardboard Container Manufacturing Industry from 2019 to 2020
II The revenue of Paper and Cardboard Container Manufacturing Industry
From January to September 2020, the Chinese paper and cardboard container manufacturing industry has accumulated 203.714 billion yuan (USD 30.97 bn) in prime operating revenue, with a year-on-year growth of -4.81%. In July, the prime operating revenue reached 23.689 billion yuan (USD 3.6 bn), up 3% year on year. In August, the prime operating revenue reached 24.756 billion yuan (USD 3.76 bn), up 2.2% year-on-year; In September, the prime operating revenue reached 28.705 billion yuan (USD 4.36 bn), up 6.24% year-on-year, as shown in figure 2.
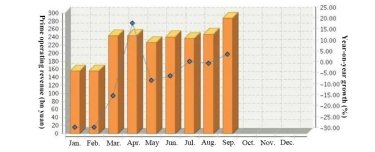
Figure 2 Chinese paper and cardboard container manufacturing industry monthly revenue and year-on-year growth
III Main economic indicators of paper and cardboard container manufacturing industry
From January to September, enterprises above designated size in the paper and cardboard container manufacturing industry realized a cumulative profit of 8.987 billion yuan (USD 1.37 bn), with a year-on-year growth of -6.58%.
From January to September, the cumulative operating profit margin of the paper and cardboard container manufacturing industry was 4.41%, with a year-on-year growth of -0.08%.
From January to September, the cumulative proportion of loss of paper and cardboard container manufacturing industry was 21.41%, with a year-on-year increase of 5.44%. The loss of loss-making enterprises reached 962 million yuan (USD 146 million), a year-on-year increase of -4.38%. The inventory of finished goods reached 8.676 billion yuan (USD 1.32 bn), up 20.92% year on year. The main economic indicators of paper and cardboard container manufacturing industry are shown in Table 1.
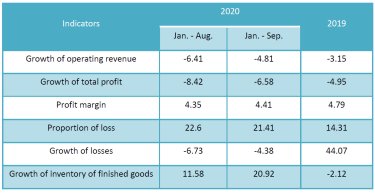
Table 1 The main economic indicators of paper and cardboard container manufacturing indu
IV The export delivery value of paper and cardboard container manufacturing industry
In September, the export delivery value of enterprises above designated size in paper and cardboard container manufacturing industry reached 963 million yuan (USD 146 million), with a year-on-year growth of -15.8%. It was down 3.01% from August, as shown in figure 3. From January to September, the delivery value of export delivery reached 6.824 billion yuan (USD 1.04 bn), with a year-on-year growth of -17.63%. The comparison of monthly export delivery value of paper and cardboard container manufacturing industry in China for three consecutive years was shown in figure 4.
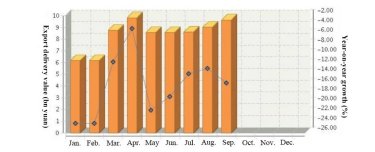
Figure 3 Chinese paper and cardboard container manufacturing industry monthly export delivery value and year-on-year growth in 2020
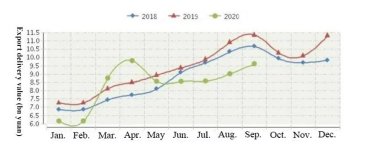
Figure 4 The comparison of monthly export delivery value of paper and cardboard container manufacturing industry in China for three consecutive years