29 OCT, 2020
Topic: Corrugated board market report, Russian market, 2019
29 OCT, 2020
Topic: Corrugated board market report, Russian market, 2019
The publication of the analytical review prepared by the Center for Systems Solutions is a group of pulp and paper manufacturing companies United Paper Mills

1. | Terms and definitions | |
2. | Summary of the economic and production situation in Russia in 2019 | |
3. | MS-5B waste paper market in 2019 | |
3.1. | The formation of MS-5B waste paper | |
3.2. | Collecting MS-5B waste paper | |
3.3. | Recycling of MS-5B waste paper | |
3.4. | Exports and imports of MS-5B waste paper | |
3.5. | Price situation on the MS-5B waste paper market | |
3.6. | Government regulation | |
3.7. | MS-5B waste paper market outlook | |
4. | Cardboard market in Russia in 2019 | |
4.1. | Production of cardboard in Russia | |
4.2. | Exports and imports of cardboard in Russia | |
4.3. | Consumption of cardboard in Russia | |
4.4. | Projects to increase the capacity to produce cardboard | |
4.5. | Price situation on the cardboard market in Russia | |
4.6. | Prospects for the development of the cardboard market | |
5. | Corrugation market in 2019 | |
5.1. | Corroproduction production in Russia | |
5.2. | Exports and imports of corrugated products in Russia | |
5.3. | Consumption of corrugated products in Russia | |
5.4. | Price situation on the corrugated products market in Russia | |
5.5. | Planned increase in corrugated production capacity in Russia | |
5.6. | Prospects for the development of the corrugated market | |
Disclaimer | ||
Waste is a waste of paper and cardboard production and consumption.
MS-5B macula is a waste of the production and consumption of corrugated cardboard, paper and cardboard used in its production (GOST 10700-97 Maculatura paper and cardboard.
Recycling (consumption, recycling, recycling) - the use of waste paper as raw materials for the production of products and packaging, components used in their production.
Accumulation of waste paper - storage of waste paper in the warehouse of the enterprise or at the site of separate collection of waste paper.
The collection of waste paper is an activity to remove waste paper from the object of waste paper accumulation.
A waste paper processor (consumer of waste paper) is a manufacturing company that uses waste paper as a raw material for production.
The source of waste paper is an economic entity or property, in the territory or during the activity of which waste paper is formed.
Households are residential properties. It is the source of waste paper.
Retail - retailers that include:
Cardboard (role-playing) is the generic name for flat layers of corrugated cardboard (liner) and corrugation paper (fluting); can be produced from waste paper (MTC) and/or from pulp (CTC).
The test liner is a liner made of waste paper.
A kraft liner is a liner made of pulp.
Corrugated cardboard (corrugated cardboard) is a material derived from bonding from one or more layers of cardboard for flat layers and one or more layers of corrugated paper for corrugation.
Commercial corrugated cardboard is a corrugated cardboard produced and supplied in the form of sheets for later processing or other purposes.
Corrocarton processing is the production of packaging from commercial corrugated cardboard.
Hofrotar is a transport or consumer packaging made of corrugated cardboard.
In the second half of 2018, there was a tendency to slow down the growth of the world economy. During 2019, this trend increased among most countries.
The risks of deterioration of the world economy were noted by many experts, and the final statistics turned out to be significantly weaker than previously expected.
For example, the International Monetary Fund (IMF)lowered its forecast for the global economy for 2019 five times, and the World Bank adjusted its forecast three times.
As a result, the IMF showed that by the end of 2019, the dynamics of world economic activity slowed to 2.9% (3.6% in 2018), falling below 3% for the first time since 2009.
According to the Russian Ministry of Economic Development,GDP growth in 2019 was 1.3% after 2.5% in 2018.
The slowdown in economic growth was due to both external demand factors, the deterioration of the world economy and internal changes, the need to adapt the economy to fiscal policy measures.
At the same time, the Ministry of Finance of the Russian Federation notes that the impact of the latter on the country's economy and their secondary effects were exhausted in the first half of the year. The country's economy was also supported by industry.
In 2019, industrial production increased by 2.4% (after 2.9% in 2018). The growth rate of output in the industry at the end of the year was at a level close to the forecast of the Russian Ministry of Economic Development for 2019 (2.3%).
The extractive and manufacturing industries made approximately equal contributions to the dynamics of industrial production (1.1 p.p. and 1.2 p.p., respectively). Manufacturing output increased by 2.3% in 2019 (2.6% in 2018).
The main drivers of manufacturing growth were the food industry, metallurgy and the chemical industry. At the same time, the production of machine-building products at the end of the year showed negative dynamics.
Production of pulp and paper products in 2019 had a moderate growth rate, but in some main positions there was a decline in production.
The index of paper and paper production in 2019 was 103.6% compared to the previous year. Recall that in 2018 this figure corresponded to the level of 112.6%.
In 2019, the growth rate of real cash incomes of the population increased slightly and amounted to 0.8% compared to the previous year.
The acceleration of the growth of real cash income was facilitated primarily by a significant decline in the level of consumer inflation, which at the end of 2019 amounted to 3.0% (after 4.3% in 2018).
The surge in inflation at the beginning of the year (1.0% m/m for January) was caused by an increase in the base rate of VAT from 18 to 20%, a change in excise taxes on individual goods, etc.
Among the reasons are pre-emptive price growth (producers and retail chains began to adjust prices in advance in 2018) and the caution of retail chains in the issue of price increases caused by the fragility of consumer demand. In the future, the strengthening of the national currency had an impact on price growth.
Despite a slight increase in the population's cash income, according to Rosstatdata, retail turnover in 2019 still increased to 101.6% compared to 2018.
In the structure of retail turnover, the share of food products, including beverages, and tobacco products was 47.9%, non-food products - 52.1% (in 2018 - 47.7% and 52.3%, respectively).
Source: CSR Working Group Analysis
Source: FTC Analysis
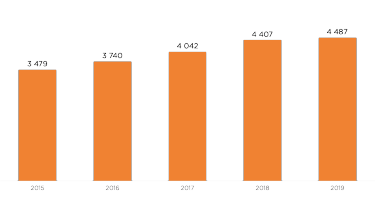
The increase in corrugated cardboard imports, together with the packaging of goods, is associated with an increase in the share of imports in retail goods. During the period under review, this indicator showed divergent dynamics.
During 2015-2016, the share of imports in retail goods was kept at 38% per year. In 2017, the rate decreased to 35.3%, but in subsequent years the share of imports in retail goods grew to 36.0% and 37.8% in 2018 and 2019, respectively.
The growth of corrugated cardboard exports is associated with an increase in exports of products for which corrugated cardboard packaging is used.
Source: CSR Working Group Analysis
The volume of waste paper collection in 2019 grew at a faster rate than the formation of waste paper. The collection rate continued to grow at 88%. It is expected that in the coming years its dynamics will stop and the dynamics of waste paper collection will be as close as possible to the dynamics of education.
Figure 4. COLLECTION of MS-5B waste paper, %
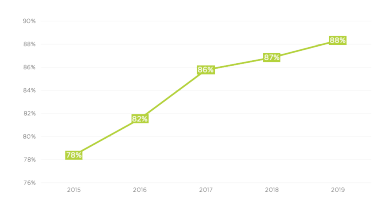
Source: CSR Working Group Analysis
Maximum waste paper collection is observed in the network retail segments and in corrugated cardboard packaging.
Non-retail and other sources have similar waste collection systems (collection may be centralized or not may also be contracted with waste cookers), but small retailers may be less affected by waste paper collection because of the small amount of waste paper formation that is of less interest to the producers.
Figure 5. The volume of recycling of waste paper brand MS-5B, thousand tons
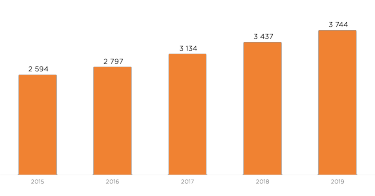
Source: CSR Working Group Analysis
The volume of waste paper processing in 2019 increased by 307 thousand tons (9%).
Growing demand with limited supply (collection of waste paper) was partially offset by a decrease in the export of MS-5B waste paper in 2019 (see p. 3.4).
Figure 6. Consumption of MS-5B
waste paper in the production of various types of products in 2018, %
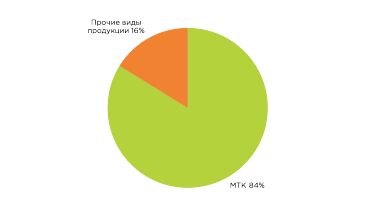
Source: CSR Working Group Analysis
The main volume of consumption of MS-5B waste paper is in the segment of waste paper cardboard. The main increase in capacity, as well as the increase in consumption is observed in this segment (see p. 4.4).
Source: CSR Working Group Analysis
The capacity of enterprises that consume waste paper as raw materials is growing more intensively than the volume of waste paper collection.
The increase in waste paper processing capacity is mainly due to modernization and the introduction of new capacity at the plants producing waste paper.
In 2019, the increase in capacity was about half of the declared year-on-year values. Some of the projects have been postponed to 2020.
Figure 8. Exports and imports of MS-5B waste paper, thousands of tons
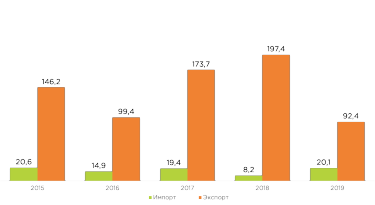
Source: FTC
Exports of MS-5B waste paper have more than halved in 2019. The main reason is the ban on the import of cardboard from Ukraine.
Intensive demand in the Russian market also stimulated a decline in exports. It is expected that with the introduction of a ban on the export of waste paper to Ukraine, the export rate of waste paper will decrease even more.
Figure 9. Ms.5B
export structure for importing countries in 2019, share (%)
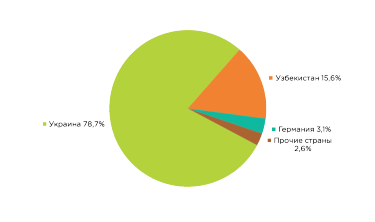
Source: FTC
Despite the restrictive measures, Ukraine remained the largest consumer of Russian waste paper by the end of 2019.
It is expected that Ukraine's share may decrease by the end of 2020 due to the ban on the export of waste paper to Ukraine, imposed by the Russian Government Decree of 16.12.2019 No. 1685.
Figure 10. MS-5B
waste paper import structure for supplier countries in 2019, %
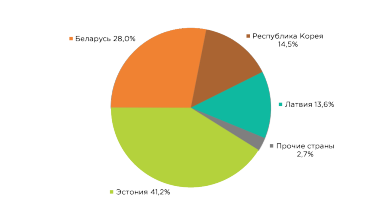
Source: FTC
The largest volume of waste paper in 2019 was imported from Estonia. At the same time, the volume of imports is still relatively small, despite an increase of 2.5 times compared to the previous year.
Figure 11. Cost of a ton of waste paper brand MS-5B, ruble (without VAT, DDP)
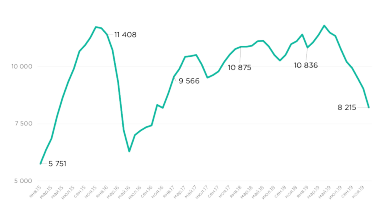
Source: Price index for the main products of the russian pulp and paper industry
The price situation in 2019 on the MS-5B waste paper market is significantly different from the trend that has developed over the past years.
Figure 12. Cost of a ton of MS-5B waste paper
in 2019, ruble (without VAT, DDP)
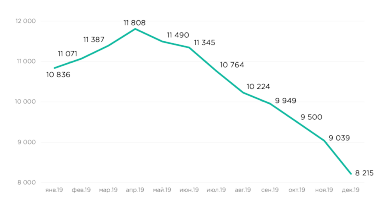
Source: Price index for
the main products of the russian pulp and paper industry
After a brief inertial growth in the first quarter of 2019, there was a rapid drop in the price, caused by a similar drop in the price of recycled paper cardboard from the beginning of 2019.
The dynamics of the price of paper tar cardboard is due to the oversupply caused by the commissioning of additional production facilities (see p. 4.4), as well as the increase in the import of cardboard as a result of overproduction in the EU countries.
In accordance with the order of the Government of the Russian Federation of 28.12.17 No. 2971-r, the standard of recycling for corrugated cardboard in 2019 is approved at the level of 35%.
In accordance with the resolution of the Russian Government of April 9, 2016, No. 284 "On setting rates of environmental duty for each group of goods to be disposed of after the loss of consumer properties paid by producers, importers of goods that do not provide independent waste disposal from the use of goods" rate of environmental duty on corrugated cardboard is approved at the level of 2,378 rubles per ton.
At the end of 2019, no changes in the legislation aimed at optimizing the expanded liability of the manufacturer were adopted. The ROP mechanism remains unothused and no immediate effect is expected.
Since the beginning of 2019, a ban on the import of cardboard from Ukraine was introduced (Resolution of December 29, 2018 No. 1716-83 "On measures to implement the Decree of the President of the Russian Federation of October 22, 2018 No. 592"). As a result, the export of MS-5B waste paper to Ukraine decreased, which increased the supply in the domestic market.
Since the beginning of 2020, the export of MS-5B waste paper to Ukraine has been completely banned (resolution "On amending the resolution of the Government of the Russian Federation of December 29, 2018 No. 1685 of 16.12.2019"),which will lead to an even greater reduction in exports.
3.7. Prospects for the development of the MS-5B waste paper market
Further market dynamics will be directed towards more synchronization of the indicators of education, collection and consumption of waste paper.
The reasons are the minimization of net exports of waste paper, as well as reaching close to the maximum values of waste collection. It is possible to increase the import of waste paper in the near term.
Discussions are continuing on the optimization of the manufacturer's enhanced liability mechanism in terms of legislative regulation.
It is this mechanism that will ensure a sustainable increase in the overall level of waste paper collection of all brands and expand the supply of MS-5B waste paper to the manufacturers of cardboard by replacing the MS-5B brand with other types of waste paper in other segments of the waste paper industry.
4.1. Cardboard production in Russia
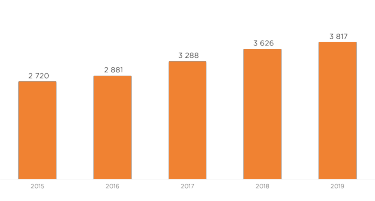
In 2019, the rate of growth of tar cardboard production in Russia decreased. The total increase in production amounted to about 80,000 tons (1.8% compared to 2018), which is significantly less than the previous years.
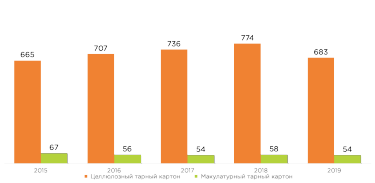
Figure 13. Production of cardboard in Russia, thousands of tons
Source: CSR Working Group Analysis
The decrease in the increase in total production is due to a decrease in the production of pulp plate in 2019 by 181 thousand tons (-9.7%) compared to 2018.
The main part of the decline in pulp plate production occurred between April and July, which is associated with planned stops for the modernization of production.
One of the additional factors in the decline in pulp plate production was the decline in export demand against the background of overproduction of cardboard in Europe.
In recent years, the increase in the production of cardboard in Russia was most mainly due to the increase in the production of paper tar cardboard. 2019 was no exception, production increased by 261 thousand tons (10.3%) 2018.
The increase in volumes is primarily related to the modernization of existing production facilities and the commissioning of new production facilities.
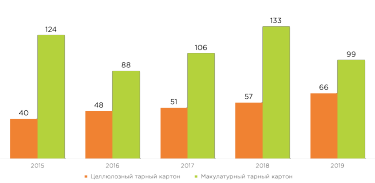
Figure 14. Production of pulp plate in Russia, thousands of tons
Source: CSR Working Group Analysis
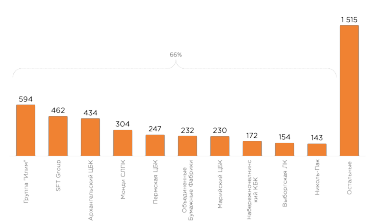
The tar cardboard market in Russia is characterized by a high concentration. The ten largest companies produce about 66% of all production (and there are about 50 manufacturing companies on the market).
In recent years, the leading producers of cardboard have remained the companies producing pulp plated cardboard - the Ilim Group and the Archangel CBK.
By the end of 2019, the largest manufacturer of paper tar cardboard in the country - SFT Group - took second place. However, this was made possible by the fact that the Arkhangelsk CBK carried out the implementation of the project on planned modernization of production (KDM No. 2).
It is expected that in the near future the situation is unlikely to change much: the share of the ten largest companies will grow, the Ilim Group and Arkhangelsk CBK will increase their share and maintain market leadership.
The waste division companies - SFT Group, Permian CBK and United Paper Mills - will also strengthen their positions in the Russian cardboard market (see 4.4) by expanding production.
In 2019, there was a decrease in the export of cardboard, especially pulp, against the background of the implementation of projects to modernize and expand a number of production facilities in Russia, as well as overproduction of cardboard and the decline in consumer demand in Europe. Imports of pulp cardboard, on the other hand, have increased.
A significant part of the supply was sold within the framework of intra-corporate transactions (companies with assets in Russia for the production of corrugated products and the production of cardboard in Europe). This trend is connected with the fact that the import of cardboard has become profitable for European companies due to the decline in prices in Europe.
Figure 17. Exports of cardboard in Russia, thousands of tons
Source: FTC
Figure 18. Imports of tar cardboard in Russia, thousands of tons
Source: FTC
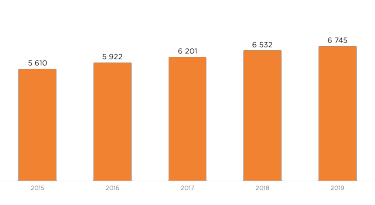
In 2019, the consumption of cardboard increased by 150,000 tons (4%) up to 3,915 thousand tons, compared to 3,765,000 tons in 2018. The share of paper tar cardboard in the structure of domestic consumption increased to 73% (by 230,000 tons, 8.8% compared to 2018).
The change in the consumption structure of tar cardboard is primarily due to the dynamics of production: the expansion of the supply of paper tar in the domestic market, combined with the reduction in the production of pulp tar cardboard, allowed the producers of corrugated cardboard and packaging to significantly increase the purchase of this type of raw materials.
Figure 19. The consumption structure of cardboard in Russia, thousands of tons
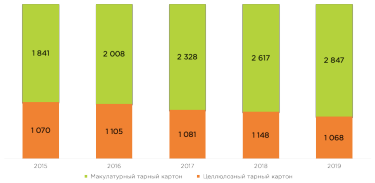
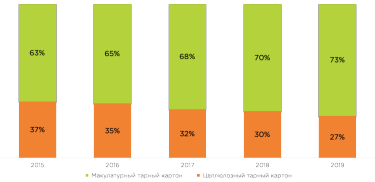
Source: CSR Working Group Analysis
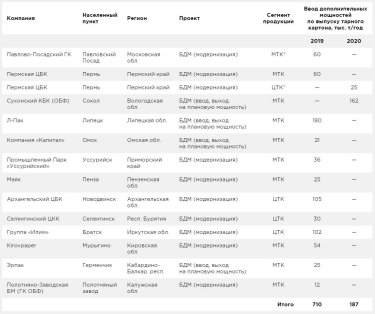
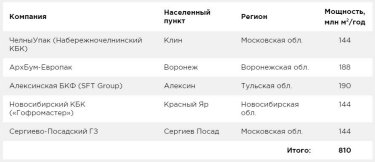
Table 2. Projects to increase the capacity to produce cardboard, which are in the process of implementation
Source: CSR Working Group Analysis
ITC - waste paper tar cardboard; CTC - cellulose tard cardboard; KB - craft paper
2019 is characterized by increased competition in the cardboard market and a decrease in the profitability of its production. The reason is the increase in supply with less growth in demand. The growth of the capacity for the production of cardboard by the end of 2019 amounted to 710 thousand tons.
Most of the increased capacity is the capacity to produce waste paper tar cardboard.
Since most of the paper tar cardboard produced in Russia has virtually no demand in foreign markets (export potential is only in high quality tar cardboard), the increase in capacity has led to an increase in supply in the domestic market.
At the same time, there is no such high demand for corrugated products, which would allow to consume such a volume of cardboard.
The supply surplus in the Russian market, associated with the expansion of capacity and the growth of imports, led to a decrease in the price of cardboard.
Figure 21. The cost of cardboard in Russia in 2019,
ruble/t (EXW, without VAT)
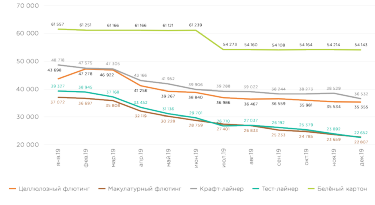
Source: Price index for the main products of the russian pulp and paper industry
There is potential for the growth of the cardboard market in Russia. However, the epidemiological situation around the world, and in our country in particular, is quite complex and extremely dynamic. In this regard, it is worth paying attention to the trends, not the so-called accurate forecast.
In the near term, the cardboard market will continue to develop, but the growth rate of production will be lower than the last few years. The growth of the market will be mainly due to the growth of the production of paper tar cardboard.
Its share will increase both in the structure of production and in the consumption structure, gradually approaching the European indicators (≈77-78%).
We should also expect a further increase in the concentration of the market due to the possible acquisition (unification) of some large companies of others, so the share of the largest players in the market will continue to increase.
There is also the possibility of moving into the packaging materials segment, including cardboard, players from the segment of paper information media.
The introduction of new container cardboard production facilities will increase the technological potential of the entire market segment, which will contribute to increased competition and the departure of low-performance, low-quality capacity from the Russian market.
In addition, there is a tendency to increase consumption of low-gram cardboard, which will also require manufacturers to develop a certain level of technology and the appropriate condition and capabilities of equipment.
The price situation in the cardboard market will largely be determined by the development of the price situation in the commodity markets of waste paper and pulp, as well as the dynamics of the corrugated cardboard market and packaging from it, which determines the demand for cardboard.
Changes in the export potential of pulp plate will also be able to make significant adjustments to the scenario of the development of the cardboard market in the future.
Source: CSR Working Group Analysis
The bulk of corrugated cardboard produced in Russia is consumed by the producers themselves for further processing into corrugated cardboard. The rest of the volume is sold as a commercial corrugated cardboard, used as packaging or for further processing into corrugated at the capacity of other enterprises.
To date, there are more than 600 companies in Russia, one way or another engaged in the production of corrugated products.
Approximately 45% of them are full-cycle companies (they have corrugatedugation (s) and corrugation lines), and 55% are processing companies (buy raw materials - corrugated cardboard, have only processing lines).
To date, the share of the largest companies in the total production of corrugated products is 52% and with a high probability will continue to grow (due to the expansion of production, see p. 5.5.).
Most of the major players are vertically integrated companies with their own raw materials base: SFT Group, Archbum (a subsidiary of Arkhangelsk CBK), L-Pak, KBK, Pavlovo-Posada Gofrocombinate, Ilim Group (Ilim Gofra)and Perm CBK.
Also on the market are large unintegrated domestic(GOTEC)and foreign companies(Stora Enso, Smurfit Kappa).
Many of the largest producers have several production sites located in different regions of the country.
Figure 23. Estimated production volumes of the top 10 largest producers of corrugated products in Russia by the end of 2019, million sq m
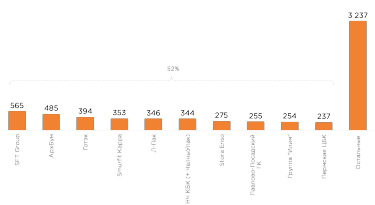
Source: CSR Working Group Analysis
Corroproduction is a lightweight and voluminous material, so its transportation (as a commodity) for considerable distances is ineffective.
The most optimal from the point of view of logistics is the delivery of corrugated products at distances not exceeding 600 km from the place of production.
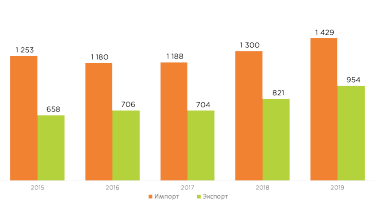
It is for this reason that the volumes of exports and imports of corrugated products, excluding the supply of packaging in goods by the end of 2019, are quite small: imports - 36 thousand tons, which is equivalent to ≈72 million sq m (1.1% of total domestic consumption), exports - 105 thousand tons (≈210 million sq m, which is 3.1% of the total output).
Cheap corrugated products are most often imported into Russia, which is shipped to the border regions from the former Soviet Union (Kazakhstan, Belarus, etc.).
In smaller volumes comes (from Europe, Asian countries) high-quality packaging and packaging with special properties, which can not be produced in the country.
Domestic producers export mainly the packaging of the middle price segment, the main areas of delivery are the countries of the former USSR.
Figure 24. Exports and imports of corrugated products in Russia, thousands of tons
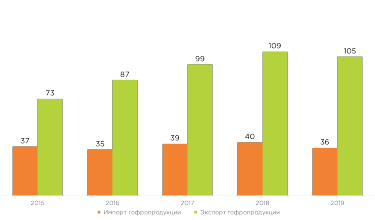
Source: FTC
The corrugated products market in Russia is developing quite actively. Existing production facilities are able to meet the demand (quantitatively) for corrugated products within the country.
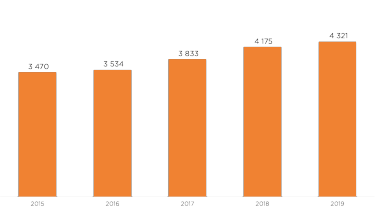
Figure 25. Consumption of corrugated products in Russia, million sq m
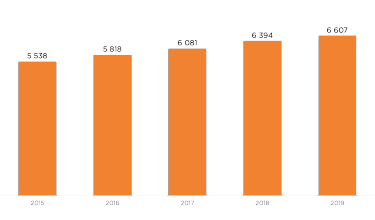
Source: CSR Working Group Analysis
The most significant driver of market growth remains the dynamics of food production. Additional support for the release in 2019 was provided by factors such as:
This group of factors should include a steady increase in the share of network structures in total retail turnover (the share of retail sales in total retail turnover increased from 27.5 per cent to 34.2 per cent during the period under review).
As well as the increase in e-commerce (the share of online sales in retail sales reached 1.7% in 2018, compared to 0.9% in 2015, data for 2019 at the time of this report were absent).
In both cases, the role of packaging in both logistics and supplier communication with the consumer is significantly enhanced.
Nevertheless, the growth rate of the market in 2019 decreased compared to the period 2016-2018.
In the coming years, the growth of the corrugated cardboard market and packaging from it will be limited by the lack of free market niches for Russian packaging manufacturers and low growth of incomes of the population.
Positive factors in market dynamics include the above factors related to changes in retail trade, as well as the development of information technology. In general, the factors that determine the dynamics of packaging output are now relatively balanced.
The difference in relative growth in corrugated production and cardboard is explained by the following factors:
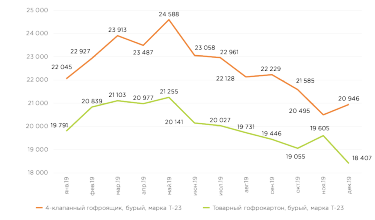
Despite the fact that the decline in prices for the main raw materials for the production of corrugated packaging - cardboard - began in the first quarter of 2019, the prices of corrugated products began to decline later (only at the end of the second quarter) and less intensively. This indicates that the profitability of production has increased for corrugated producers.
Figure 26. Cost of corrugated products in Russia in 2019,
ruble/thousand sq m (EXW, without VAT)
Source: Price index for
the main products of the russian pulp and paper industry
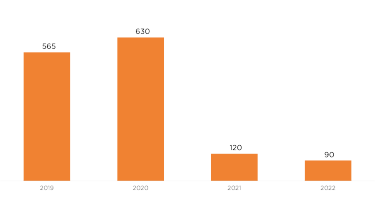
Table 3. Projects to launch new corrugated production,
implemented in 2019
Source: CSR Working Group Analysis
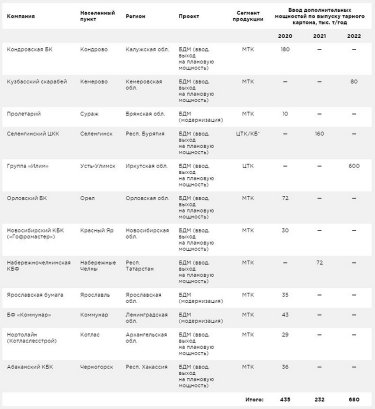
Table 4. Projects to increase corrugated production
capacity in the process
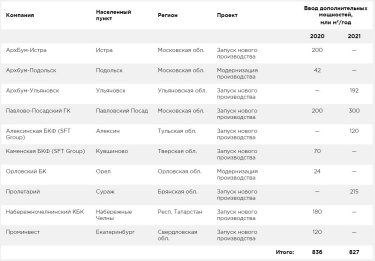
Source: CSR Working Group Analysis
The corrugated market in Russia, as well as the cardboard market, has significant potential for growth. In the coming years, the growth of the corrugated cardboard market and packaging from it will be limited by the lack of free market niches for Russian packaging manufacturers and low growth of incomes of the population.
Market growth factors are associated with changes in retail trade (growth of online retail, e-commerce, etc.), as well as the development of information technology. Exports and imports of corrugated products will not change significantly.
The share of the largest players in the corrugated products market will continue to increase. The possible takeover of smaller players by the largest players in the market cannot be ruled out.
Coupled with the introduction of new production facilities, this will contribute to the withdrawal from the market of a number of players, most likely in the European part of the country, where competition is higher.
In the near term, the price situation in the corrugated packaging market under the pressure of high level of paper cardboard supply is likely to remain relatively stable and is unlikely to exceed the level of early 2019.
Resource: https://gofro.expert/novosti/b-rynok-makulatury-ms-5b-tarnogo-kartona-i-gofroproduktsii-v-2019-g-b/